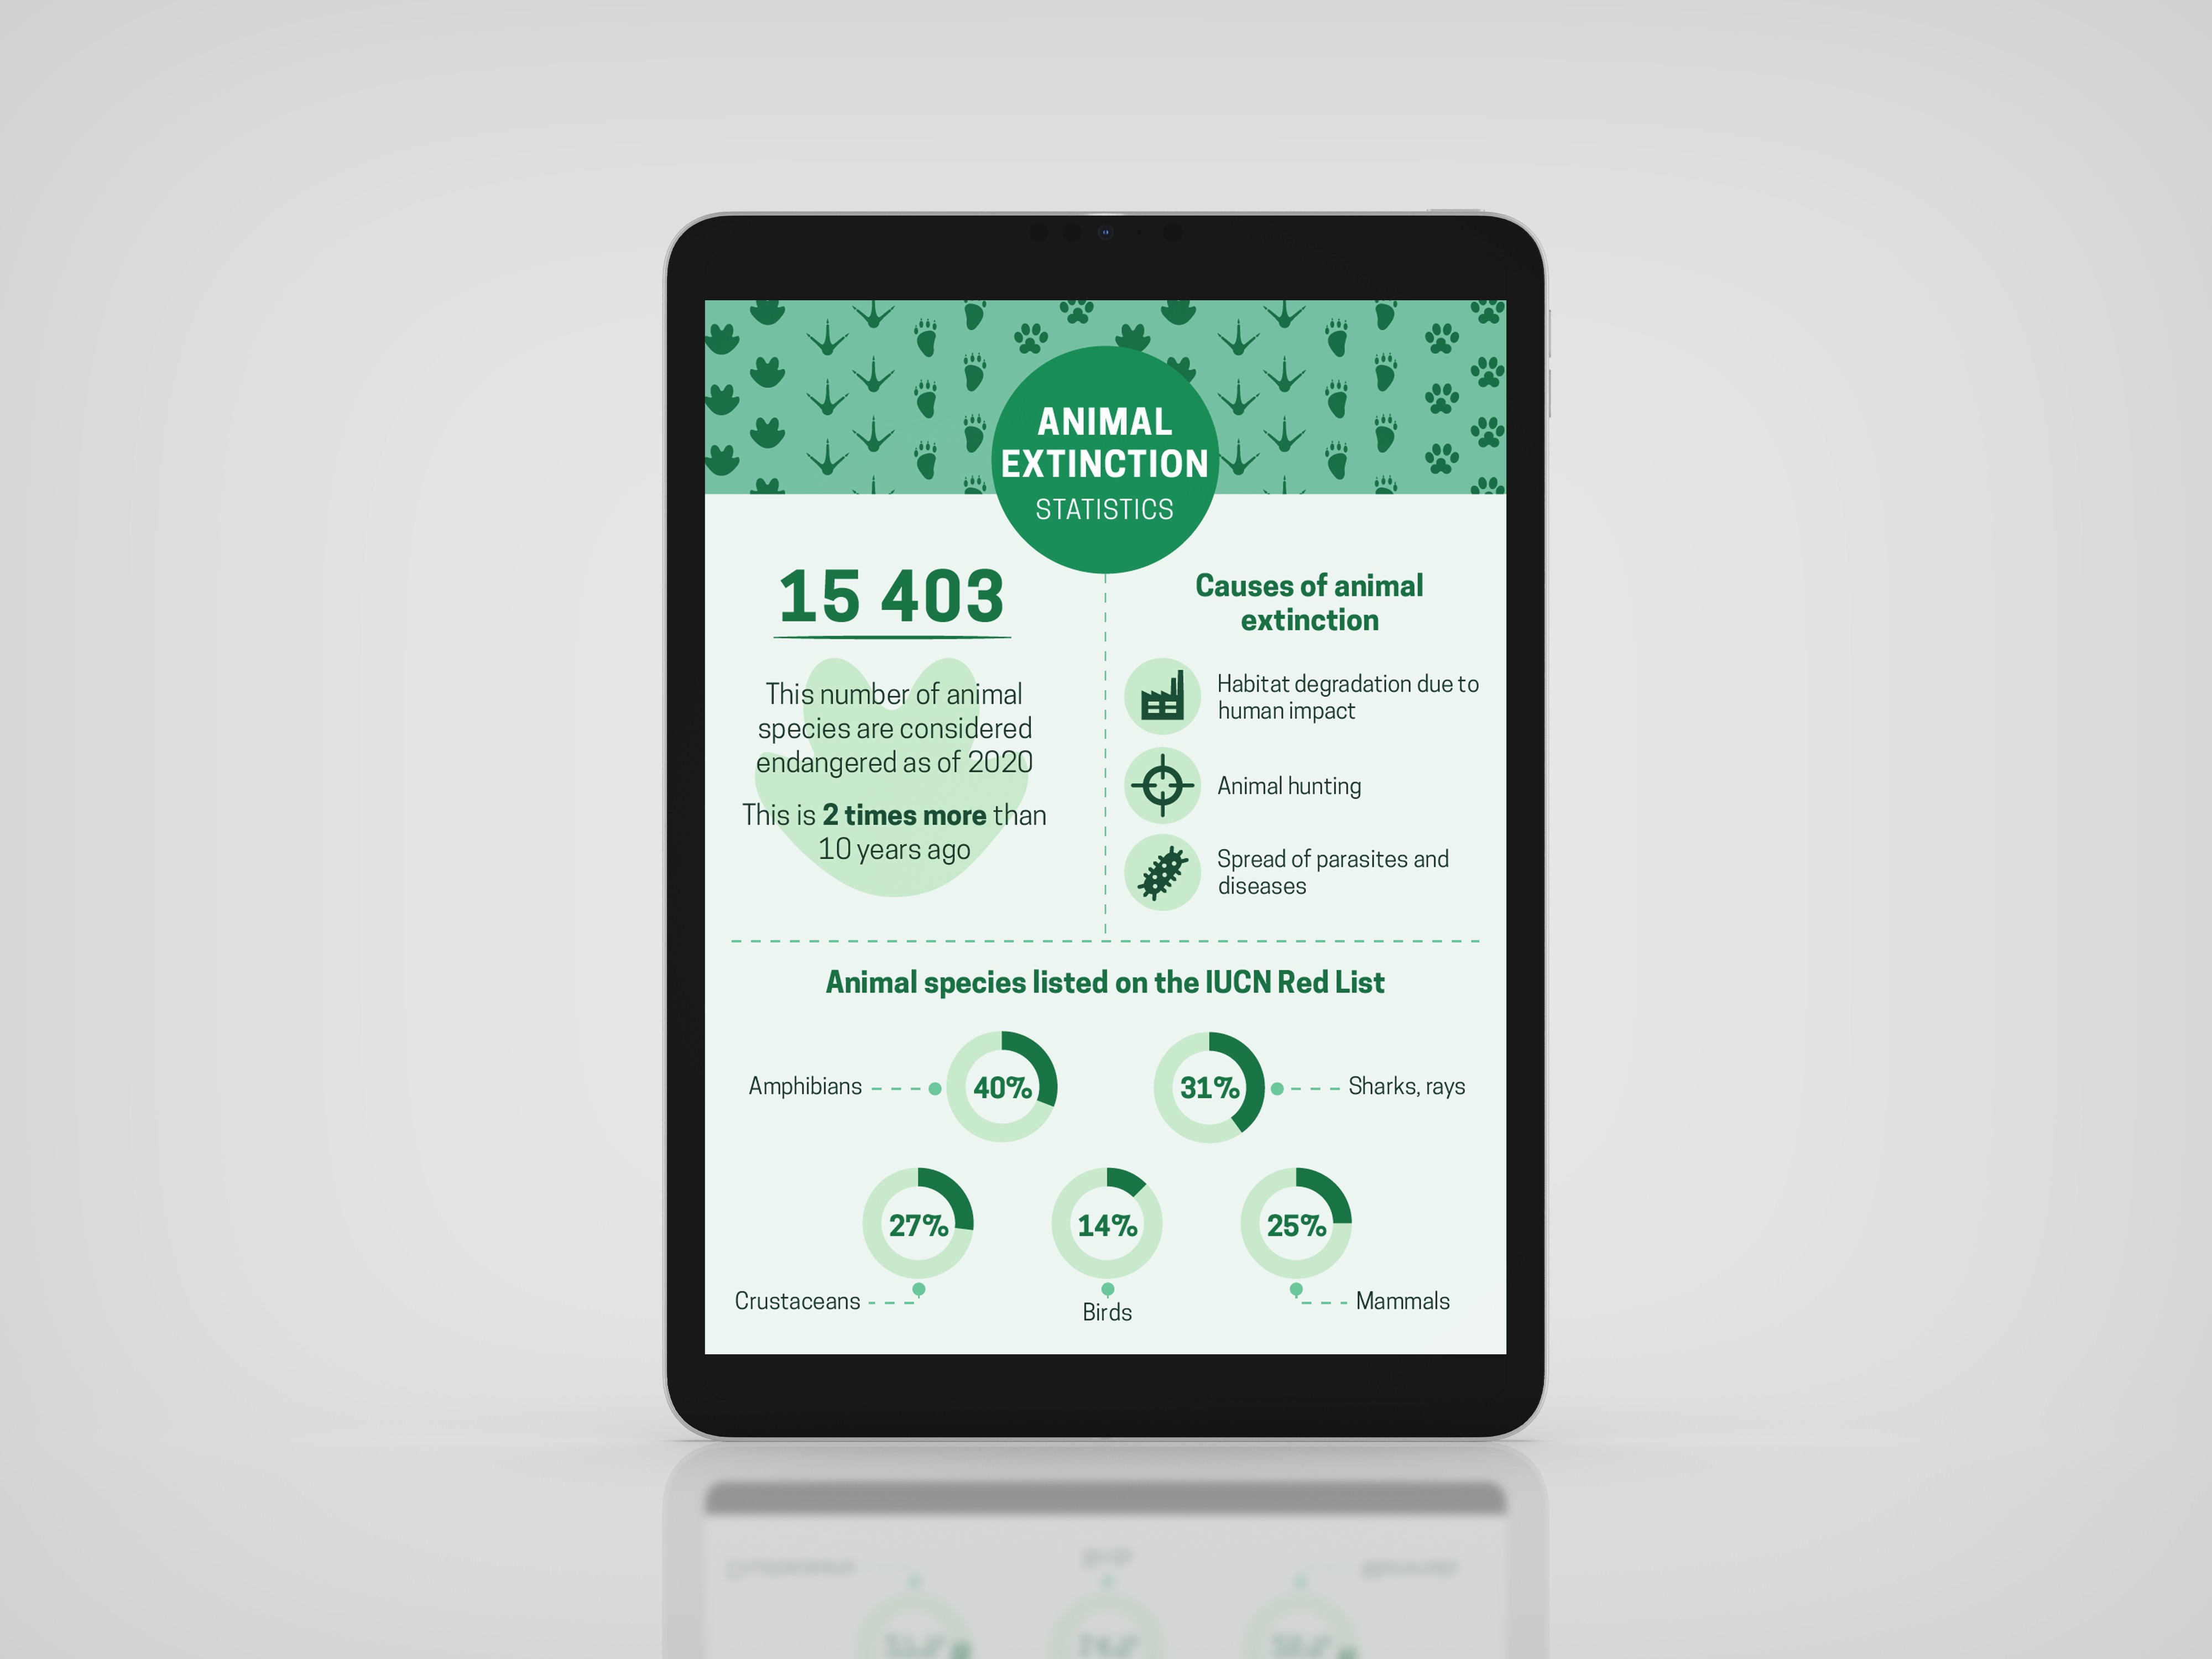

I was inspired to create this infographic by the statistical information about the extinction of animals as of 2020. I decided to visualize some important data, as a person perceives information better visually than in text format.
I drew paw prints of different kinds of animals. And diversified the upper part with them. Thanks to these elements, before reading the text, any person will understand what the infographic is talking about. For one of the design sections, I drew icons corresponding to the theme. And I visualized other statistics using pie charts.